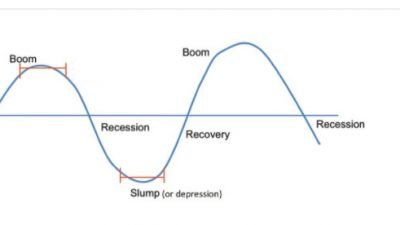
Fiscal Policy
Fiscal policy refers to the government’s ability to raise taxes and spend the money it raises. The way the government can spend more money on programs than it takes in taxes is by borrowing it, which the government does by selling bonds. The principle was that if you lower taxes on businesses and individuals, the individuals will be able to spend more, the businesses will be able to invest more and the economy as a whole will grow. President Obama did raise taxes but primarily on people earning about 450 thousand dollars a year. Corporate tax rates have also declined, and social security taxes have gone up, which is important because this is the federal tax that most of us are most likely to pay. Overall the percentage of revenue that the federal government receives from taxes has helped pretty steadily and between 43 percent and 50 percent. There are certain items in the federal budget that must be spent because they are written into law by Congress; these are called uncontrollable or mandatory spending. Subsidies are also counted as uncontrollable and they are important but not nearly as important as the two big-ticket mandatory spending items, are social security and Medicare, they are paid for with dedicated federal taxes. They provide income and health insurance for elderly people and it is unlikely that the amount the government spends on them is going to decline anytime soon. There is only a limited range of programs on which the government can choose to spend or not spend, these are called discretionary spending. In addition to cutting and spending the government can balance its budget by raising taxes.
Monetary Policy
The Federal Reserve is in charge of monetary policy in the United States. Monetary policy is the way the government regulates the amount of money in circulation in the nation’s economy. Controlling the money is the primary task of the Federal Reserve System. The fed has 2 primary tasks:
- To control inflation
- To encourage full employment
Fed is also responsible for clearing checks and for supplying actual currency. The fed also sets approvals for banks, although these can also be set by Congress. But the most important thing the fed does is loan money to other banks and set interest rates. The Fed loans money to banks; which they in turn loan out to businesses and individuals and like all loans, the fed charges interest. The fed sets the rate on the interest called the discount rate and this determines mostly how much money banks will borrow. The lower the rate, the more banks will borrow and the more money goes into circulation. Other banks peg the interest rates they charge to the Fed’s rate, charging slightly more, so in this way the fed determines, or sets, interest rates in the economy as a whole. The fed also creates regulations that control how much money circulates in the economy; one of these is the bank reserve requirement or the amount of money in cash that a bank has to have on hand. The amount of money that a bank holds in a reserve is only a fraction of the total amount of money held in deposit at the bank, that’s why it is called fractional reserve banking. Raising a reserve requirement reduces the amount of money in circulation, and lowering it pumps more money into the economy. The Federal Reserve also sets the interest rate banks charge to lend money to each other, which again controls the amount of money that circulates. The fed buys and sells government debt in the form of treasury bills or government bonds, when the fed sells bonds it takes money out of the economy, and when it buys them; more money goes into the economy; this is called open market operations. If there should be a lot of money in circulation, yet inflation remains quite low. Usually, low-interest rates tend to cause inflation and reduce unemployment and high-interest rates are expected to cool down an overheating economy, but that hasn’t happened much in the past few years. Monetary policy is one lever that the federal government can use to influence the economy.
Opportunity cost
Opportunity cost is one of the most important concepts in macroeconomics. Very simply, everyone has the same amount of hours in a day, but we all make different decisions about what we do, what we choose to buy, and how we spend our time. What determines these choices? Opportunity cost does. Every time you make a choice there is a value you place on that choice, you might not know it, or think about it, but every choice has a value to you. And when you choose one thing over another, you are saying to yourself, I value this more than another choice I had. The opportunity cost of a choice is what you gave up to get it. If you have two choices, either an apple or an orange and you choose the apple, then your opportunity cost is the orange you could have chosen, but didn’t. You gave up the opportunity to take the orange, in order to choose the apple. In this way, an opportunity cost is the value of the opportunity lost. A Value has 2 parts to it; it has benefits as well as cost. If you choose an apple over an orange, maybe the apple costs less but maybe you enjoy it more. So looking at choice in terms of benefits and costs, helps you make better economic decisions. To make a good economic decision, we want to choose the option with the greatest benefit to us but at the lowest cost. You are thinking economically when you look at the value of a choice through the eyes of the benefits and the costs. Whatever we choose, the opportunity cost is the value of the choice we could have had.
Comparative advantage
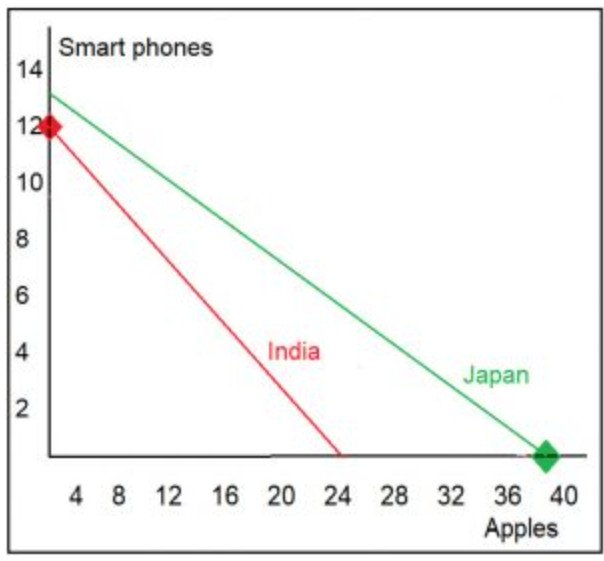
Some concepts of International trade refers to the exchange of goods and services between nations, in a way that it is mutually beneficial for the nations involved in the trade. To understand what makes trade between nations mutually beneficial, we must first understand how a country can determine what it’s specialized in trade with the rest of the world for. Therefore we are going to look at two countries, Japan and India, and the production of two goods, apples and smartphones. The production possibilities of Japan and India are demonstrated in the following production possibilities table.
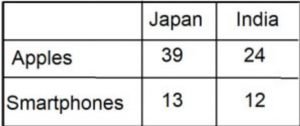
 Notice that with a fixed amount of resources, Japan and India can produce the following amounts of apples and smartphones: Japan can produce 39 apples or 13 smartphones. We know based on the concept of production possibilities that it is not within the realm of possibility for Japan to produce both 39 apples and 13 smartphones since the resources needed to produce these goods are scarce. Similarly, India cannot produce 24 apples and 12 smartphones since scarcity limits its ability to produce these two goods. However, if all of their resources are allocated towards apples then Japan could produce 39 and India could produce 24. If all of their resources are allocated towards the production of smartphones then Japan could produce 13 and India could produce 12. The following image is also plotted the production possibilities of Japan and India in a production possibilities curve diagram.

As you can see, the green and red lines represent the production possibilities of Japan and India respectively. The first concept we need to introduce in our international trade is that of absolute advantage. An absolute advantage exists when a country can produce more of a particular good than the other country, using a certain amount of resources. In our example, it should be clear that Japan can produce more apples and more smartphones than India. So we can say that Japan has an absolute advantage in the production of both smartphones and apples. In other words, Japan is more efficient than India in the production of these two goods. The production possibilities curve represents how much of two particular goods each country can produce if all of its resources are being used efficiently towards the production of those two goods. Clearly, we can see that Japan is more efficient in the production of both of these goods, therefore we can say that Japan has an absolute advantage in the production of both goods. But does this mean that Japan could not stand to benefit from specializing in one of the goods in trading with India for the other? The answer is no, it does not. Trade should be based on what countries have comparative advantages in the production of. So to understand what is comparative advantages, we first must define it and then we will determine which country has comparative advantages in apples and smartphones, using the data in our table and on our graph. A comparative advantage exists when a country can produce a particular good at a lower opportunity cost than a potential trading partner or another country. Opportunity cost is a concept fundamental to economics. It refers to what is given up in order to have something. To determine who has a comparative advantage in apples and who has a comparative advantage in smartphones, we must, therefore, calculate the opportunity cost of these two goods in both countries. Using the data in our table and on our graph we know that in Japan, if all resources are allocated towards apple production, then 13 smartphones are being given up. In other words, 39 apples cost Japan 13 smartphones. So I can say that 39 Apples equal 13 Smartphones. To determine the opportunity cost of one apple, we must, therefore, find out how much one Apple equals in terms of smartphones. This is a very simple calculation that anybody should be familiar with, divide both sides by 39 and we can see that 1 apple in Japan costs 1/3 = 0.33 Smartphone.
Japan (39 Apple)/39 = (13 Smartphone)/39 or 1 Apple = 1/3 (or 0.33) smartphone
We have now calculated the opportunity cost of apples in terms of smartphones in Japan. For every one apple that Japan chooses to produce, it will be giving up 1/3 of a smartphone. Let’s go ahead and calculate the opportunity cost of apples in India, then we will know which country has a lower opportunity cost of apples.
India (24 Apple)/24 = (12 Smartphone)/24 or 1 Apple = 1/2 (or 0.5) Smartphone . We can do a similar calculation for India. We know that if India allocates all of its resources towards apple production it can produce 24 apples; however, to do so it would be giving up 12 smartphones. Divide both sides by 24, and we can see that in India one apple comes along with the opportunity cost of 0.5 smartphones.
The conclusion is that for every one apple India chooses to allocate its resources towards, it is essentially giving up half of a smartphone. Compare this to the lower smartphone cost of apples in Japan, now we can see pretty clearly, that Japan has a comparative advantage in the production of apples due to the fact that its opportunity cost is lower. We can go ahead and do the same calculations to determine the opportunity cost for smartphones in the two countries. Japan (13 Smartphone)/13 = (13 Smartphone)/39 or 1 Smartphone = 1/3 (or 0.33) smartphone
If Japan were to allocate all of its resources towards smartphone production, it could produce 13 smartphones but to do so it would be giving up 39 apples. So, 13 smartphones come at the opportunity cost of 39 apples. This correlates with a per smartphone opportunity cost of 1Smart phone = 3 Apples, in other words for every smartphone Japan produces it will be giving up 3 apples. Let’s go and calculate the opportunity cost of smartphones in India.
India (12 Smartphone)/12 = (24 Apples)/12 or 1 Smartphone = 2 Apples
India can produce 12 smartphones, or 24 apples, for every smartphone it produces it will, therefore, be giving up 2 apples. So the question is where is the opportunity cost of smartphones lower? Clearly, India has a lower opportunity cost for smartphones. So we can say now, that Japan has a comparative advantage in apple production and India has a comparative advantage in smartphones.
Determining who has a comparative advantage in the production of a particular good requires some calculations; you must determine who a lower opportunity has cost in the production of each good, in order to determine who has a comparative advantage. However, the trade doesn’t necessarily need to be based on who can produce more of a particular good; rather it should be based on who can produce a good at a lower opportunity cost. If Japan and India were to specialize in the production of the goods for which they have a lower opportunity cost, then both countries can potentially gain from trading with one another. In other words, Japan could allocate all of its resources towards apple production, which should put Japan and India down and up at the points where are indicated by the green and red dot respectively on the production possibilities curve (see the next image).


Source: www.investopedia.com
What is ‘Fractional Reserve Banking’
Fractional reserve banking is a banking system in which only a fraction of bank deposits are backed by actual cash on hand and are available for withdrawal. This is done to expand the economy by freeing up capital that can be loaned out to other parties. Many U.S. banks were forced to shut down during the Great Depression because too many people attempted to withdraw assets at the same time.
BREAKING DOWN ‘Fractional Reserve Banking’
Banks are required to keep a certain amount of the cash depositors give them on hand available for withdrawal. That is, if someone deposits $100, the bank can’t lend out the entire amount. That said, it isn’t required to keep the entire amount either. Most banks are required to keep 10% of the deposit, referred to as reserves. This reserve requirement is set by the Federal Reserve and is one of the Fed’s tools to implement monetary policy. Increasing the reserve requirement takes money out of the economy, while a decrease in the reserve requirement puts money into the economy.